I self-hosted my own Miniflux instance and just wanna try NewsBlur. I know I can signup in public instance but is there any benefits of self-hosting one? Can I enjoy premium functions in self-hosted NewsBlur?
You would get the premium features by self-hosting, but that comes at the cost of hosting it. If you already have a way to host it, it might be worth it. Bare minimum hosting for something like Linode or Digital Ocean is already $5/mo. At the end of the day, I use NewsBlur for a couple hours a day so $3/mo seems reasonable for Samuel to have to deal with all that infrastructure nonsense, and I say that as someone that deals with all that infrastructure nonsense for my day job. 
5 Likes
Perhaps you’ll find joy with https://fly.io/
Yep, self-hosting gives you all the benefits of unlimited premium accounts. You can also tune the unread date to be as long as you like, so a feed’s stories can stay unread for as long as you like.
I’ll warn you though, you’ll be paying a lot more than $3/month in electricity if you choose to self-host.
Here’s the instructions:
Basically, download the repo and type make nb.
1 Like
I already own my self-hosted machine so I really dun mind adding 1 more container =) I need to taste whether NB suits my ready habit.
BTW, is it only support x86 docker? I failed to make nb in my arm machine…
Should be able to run now, we just shipped multiarch docker builds.
I finally mastered to get all the containers up. But I am finding a way to access in outside LAN.
When it is put behind the nginx proxy in my home network, it returns me too many redirects…
I got every containers up but when I access it shows 502 Newsblur is down. Any idea?
Check the docker logs for newsblur_web container.
I only got 1 line “Connected to postgres” for newsblur_web. But for docker logs haproxy it has:
backend ‘node_xxx’ has no server available!
backend ‘elasticsearch’ has no server available!
backend ‘gunicorn’ has no server available!
And here is the node logs:
[2022-02-13 08:12:48]  --->  ---> No .env file found, using defaults
[2022-02-13 08:13:11]  ---> Starting Original Page server on DEV
[2022-02-13 08:13:11]  ---> Starting NewsBlur Original Text Fetcher / Mercury Parser...
[2022-02-13 08:13:11]  ---> Running as development server
[2022-02-13 08:13:11]  ---> Starting NewsBlur Favicon server...
[2022-02-13 08:13:11]  ---> Running as docker server
[2022-02-13 08:13:11]  ---> Starting NewsBlur unread count server...
[2022-02-13 08:13:11]  ---> Running as docker server
[2022-02-13 08:13:13]  ---> Starting NewsBlur Node Server: localhost
[2022-02-13 08:13:13]  ---> Connected to db_mongo:29019
Looks normal too…
What’s the output of ‘docker ps’?
docker ps -n 10
CONTAINER ID   IMAGE                                                  COMMAND                  CREATED         STATUS                          PORTS                                                                                                                 NAMES
94b8e7d47632   haproxy:latest                                         "docker-entrypoint.s…"   5 minutes ago   Up 5 minutes                    0.0.0.0:80->80/tcp, :::80->80/tcp, 0.0.0.0:443->443/tcp, :::443->443/tcp, 0.0.0.0:1936->1936/tcp, :::1936->1936/tcp   haproxy
398f31863c97   nginx:1.19.6                                           "/docker-entrypoint.…"   5 minutes ago   Up 5 minutes                    80/tcp, 0.0.0.0:81->81/tcp, :::81->81/tcp                                                                             nginx
fcece3e613bb   newsblur/newsblur_python3:latest                       "/bin/sh -c newsblur…"   6 minutes ago   Up 5 minutes                    0.0.0.0:8000->8000/tcp, :::8000->8000/tcp                                                                             newsblur_web
d83220c98b3b   newsblur/newsblur_node:latest                          "docker-entrypoint.s…"   6 minutes ago   Up 5 minutes                    0.0.0.0:8008->8008/tcp, :::8008->8008/tcp                                                                             node
4422ef5f38b3   postgres:13.1                                          "docker-entrypoint.s…"   6 minutes ago   Up 6 minutes                    0.0.0.0:5434->5432/tcp, :::5434->5432/tcp                                                                             db_postgres
fcbc9133f0b8   redis:latest                                           "docker-entrypoint.s…"   6 minutes ago   Up 6 minutes                    6379/tcp, 0.0.0.0:6579->6579/tcp, :::6579->6579/tcp                                                                   db_redis
b18e4a549a9c   ghcr.io/willnorris/imageproxy:latest                   "/app/imageproxy -ad…"   6 minutes ago   Restarting (1) 44 seconds ago                                                                                                                         imageproxy
3bf47ff0a2b7   newsblur/newsblur_python3                              "celery worker -A ne…"   6 minutes ago   Up 6 minutes                                                                                                                                          task_celery
dbf42eed04dd   docker.elastic.co/elasticsearch/elasticsearch:7.16.2   "/bin/tini -- /usr/l…"   6 minutes ago   Up 6 minutes                    0.0.0.0:9200->9200/tcp, :::9200->9200/tcp, 0.0.0.0:9300->9300/tcp, :::9300->9300/tcp                                  db_elasticsearch
3f84cf896850 mongo:3.6 "docker-entrypoint.s…" 6 minutes ago Up 6 minutes 27017/tcp, 0.0.0.0:29019->29019/tcp, :::29019->29019/tcp db_mongoJust notice imageproxy is restarting…and docker logs show
standard_init_linux.go:228: exec user process caused: exec format error
What version of docker compose are you using? It seems the containers can’t talk to each other.
I just upgraded from 1.21 to 1.28.4, they seems can talk to each other now, localhost can redirect to the web but the page looks frozen.
imageproxy still keep restarting:
standard_init_linux.go:228: exec user process caused: exec format error
I am guessing if imageproxy does not support arm…
I requested arm support in imageproxy here:
Glad upgrading fixed the issue! I haven’t seen a frozen page but I’d love to know if that’s because of anything not loading. Does the web inspector console show anything?
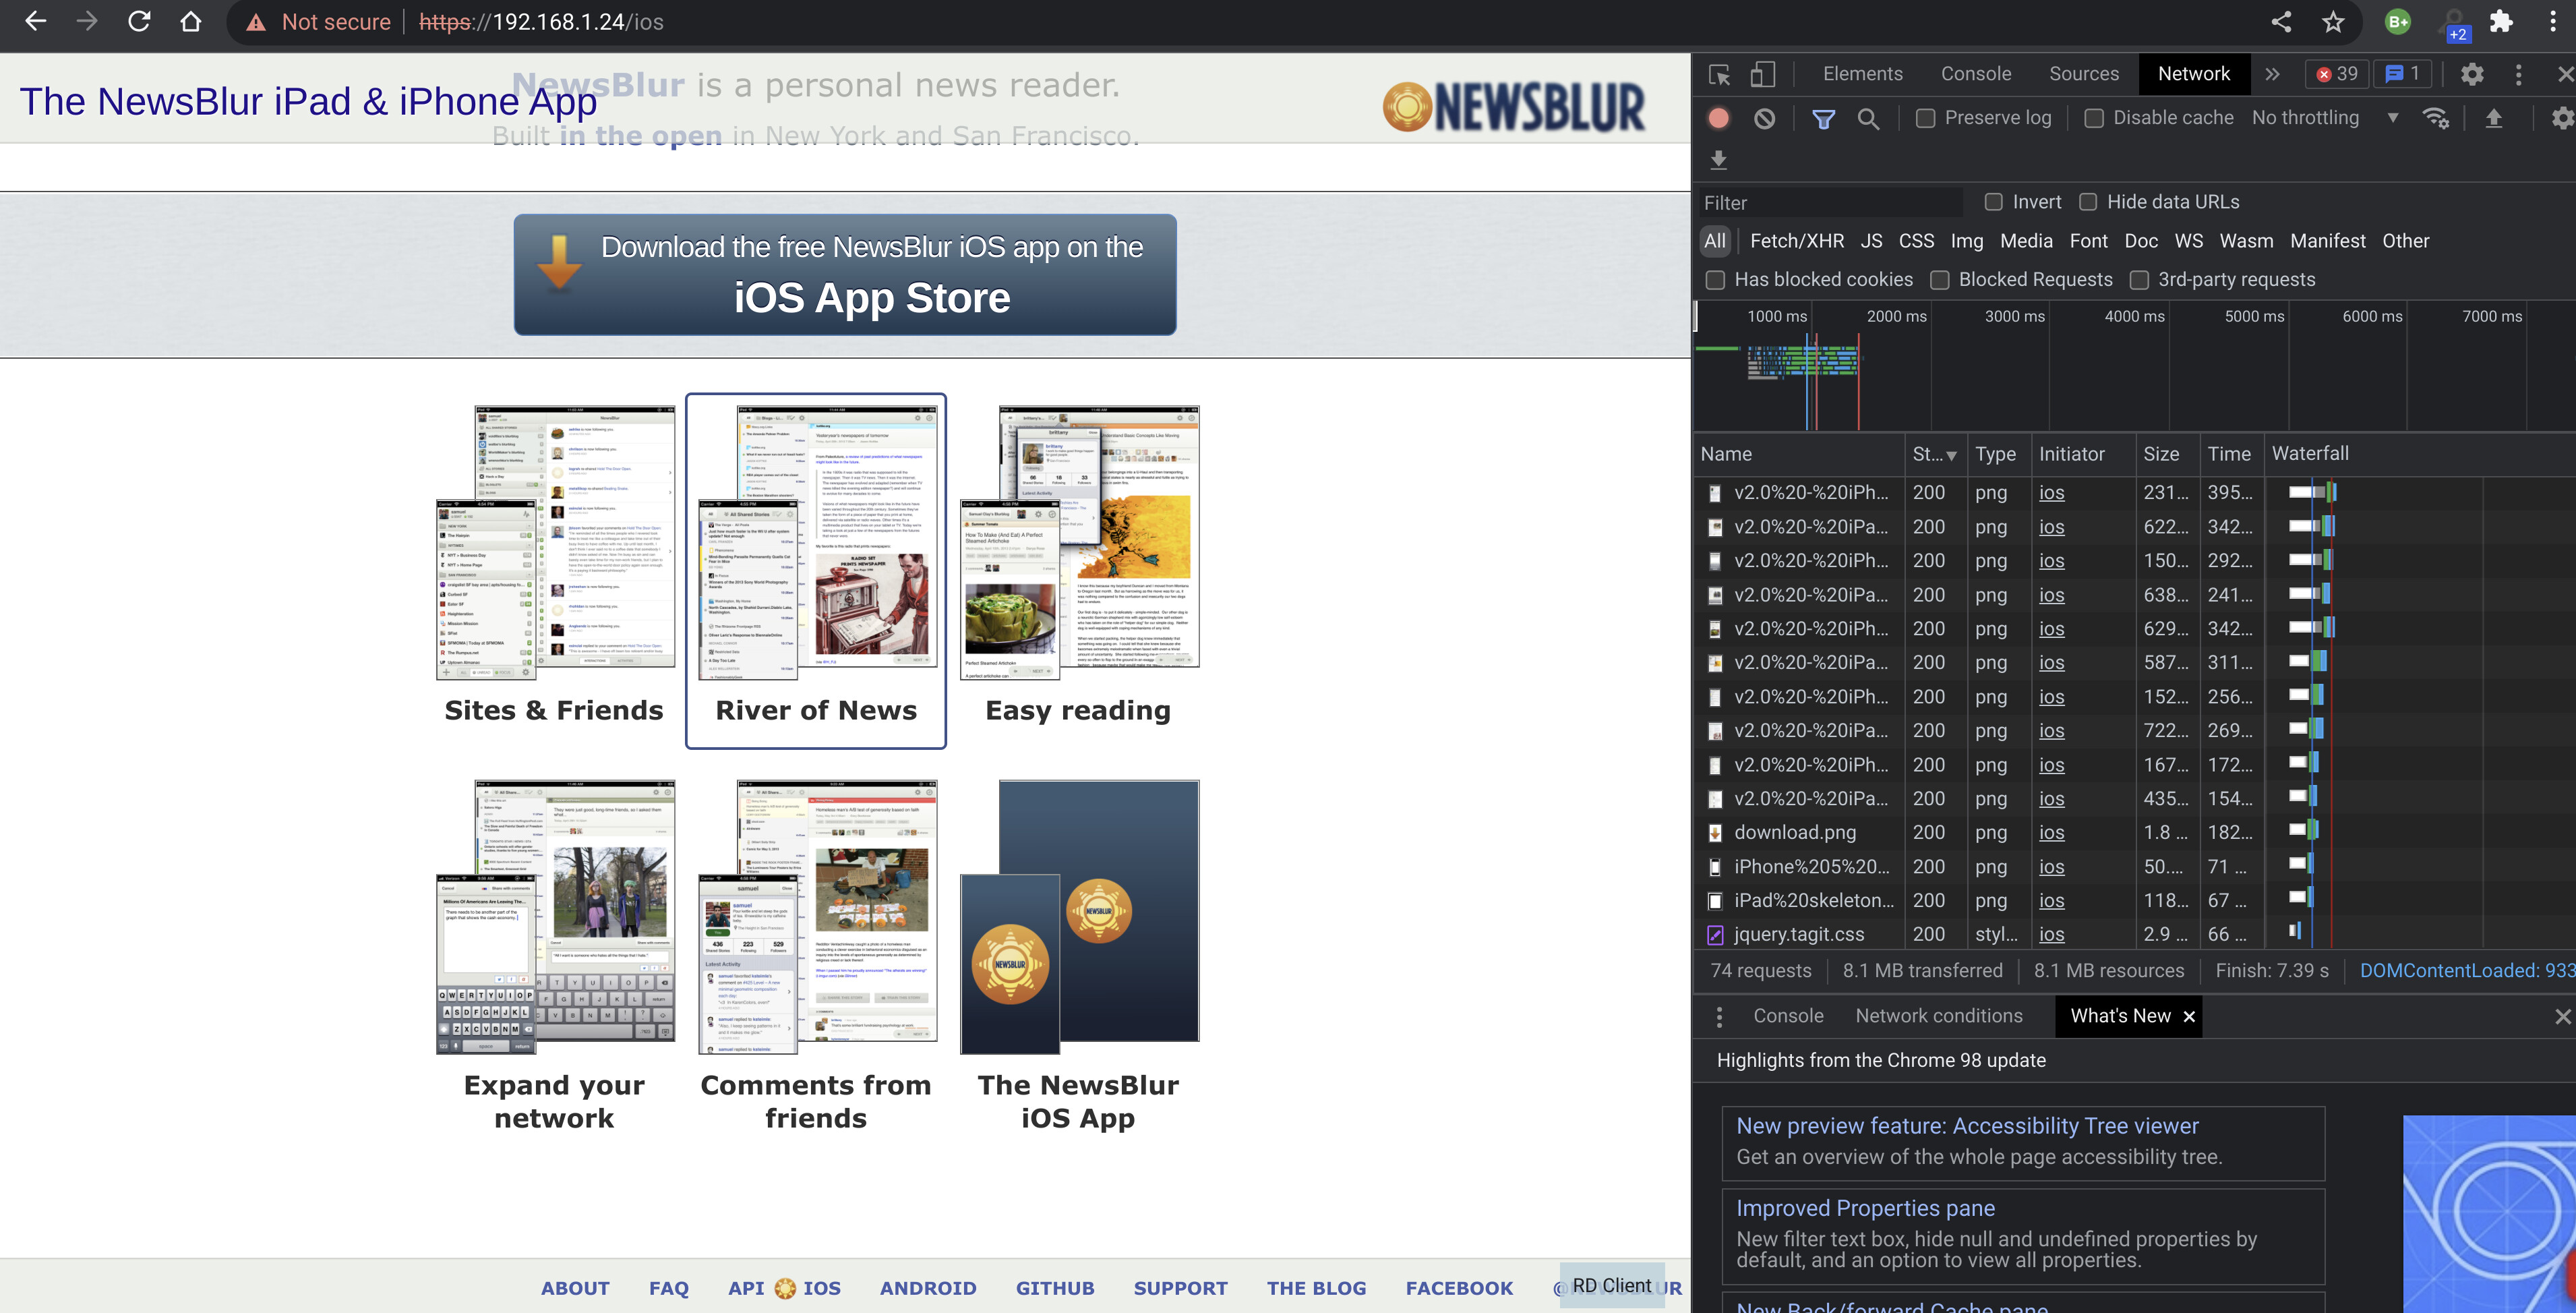
This morning I attempted to use the arm port of imageproxy (basecamp/imageproxy). The imageproxy is working but the page is still as shown. I can’t click to Sign In.
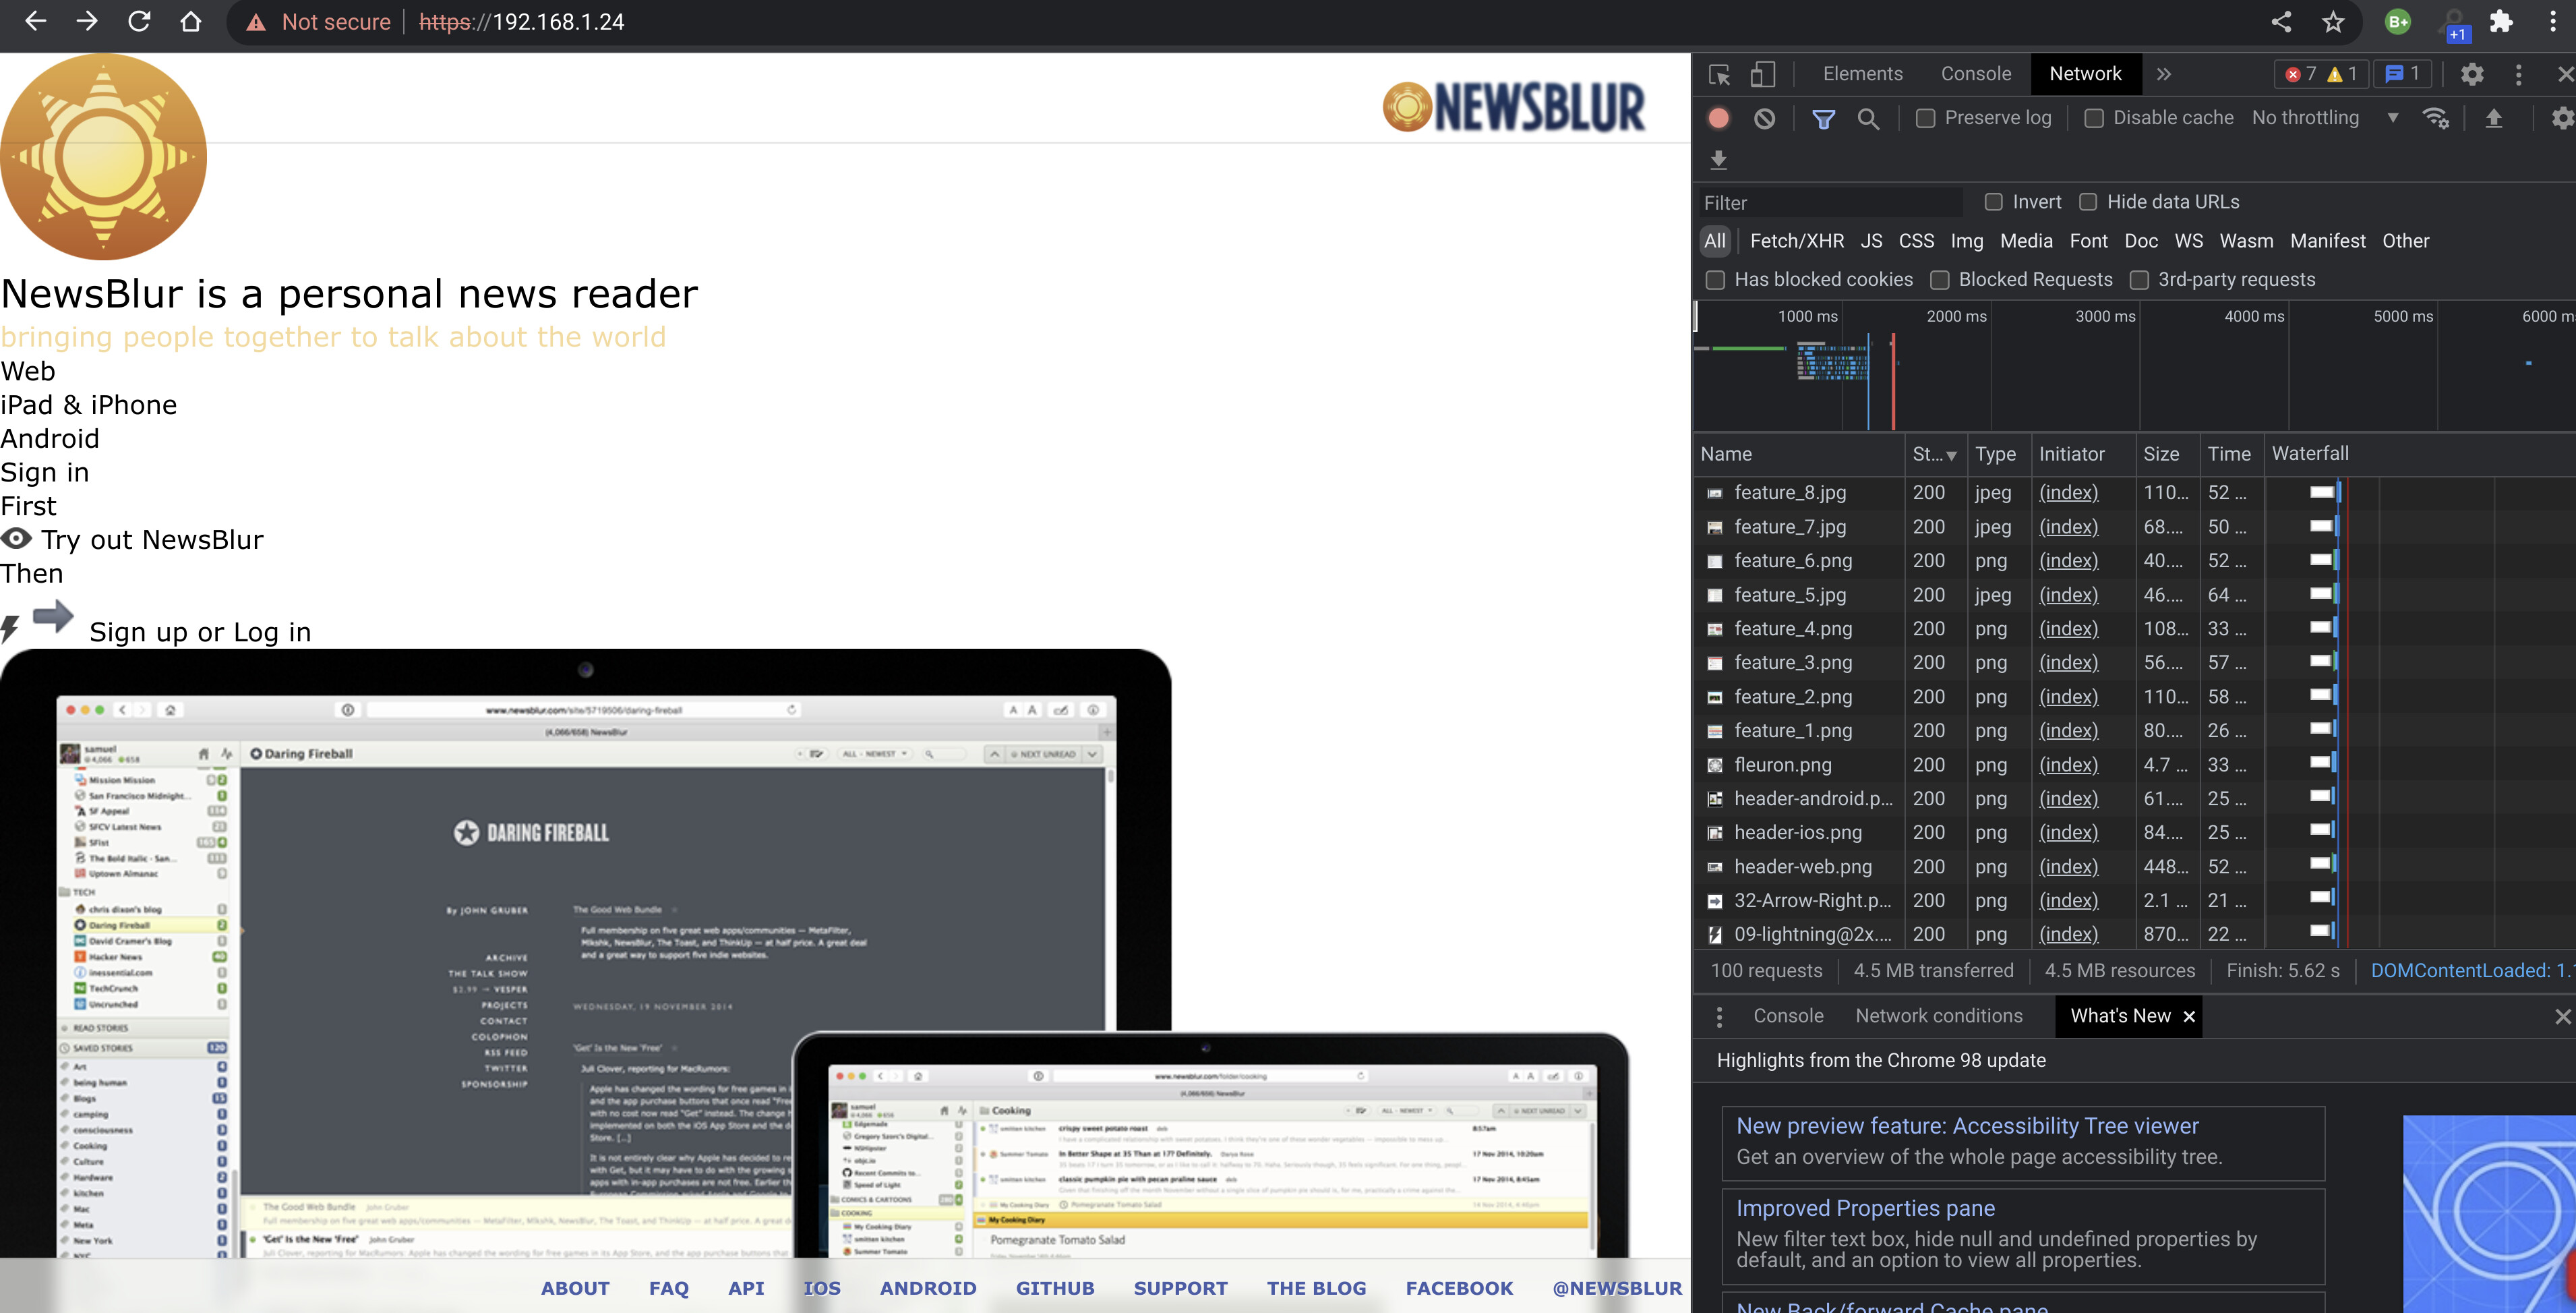
But I can click on the bar below now (e.g. ios). And I can scroll this page.
and here are the haproxy logs now:
[NOTICE]   (1) : path to executable is /usr/local/sbin/haproxy
[WARNING]  (1) : config : parsing [/usr/local/etc/haproxy/haproxy.cfg:49] : a 'monitor fail' rule placed after a 'redirect' rule will still be processed before.
[WARNING]  (1) : config : parsing [/usr/local/etc/haproxy/haproxy.cfg:50] : a 'monitor fail' rule placed after a 'redirect' rule will still be processed before.
[WARNING]  (1) : config : backend 'node_socket' uses http-check rules without 'option httpchk', so the rules are ignored.
[WARNING]  (1) : config : backend 'node_favicon' uses http-check rules without 'option httpchk', so the rules are ignored.
[WARNING]  (1) : config : backend 'nginx' uses http-check rules without 'option httpchk', so the rules are ignored.
[NOTICE]   (1) : New worker (8) forked
[NOTICE]   (1) : Loading success.
[WARNING]  (8) : Health check for server node_socket/node_socket failed, reason: Layer4 connection problem, info: "Connection refused", check duration: 3ms, status: 0/2 DOWN.
[WARNING]  (8) : Server node_socket/node_socket is DOWN. 0 active and 0 backup servers left. 0 sessions active, 0 requeued, 0 remaining in queue.
[ALERT]    (8) : backend 'node_socket' has no server available!
[WARNING]  (8) : Health check for server node_favicon/node_favicon failed, reason: Layer4 connection problem, info: "Connection refused", check duration: 1ms, status: 0/2 DOWN.
[WARNING]  (8) : Server node_favicon/node_favicon is DOWN. 0 active and 0 backup servers left. 0 sessions active, 0 requeued, 0 remaining in queue.
[ALERT]    (8) : backend 'node_favicon' has no server available!
[WARNING]  (8) : Health check for server node_text/node_text failed, reason: Layer4 connection problem, info: "Connection refused", check duration: 2ms, status: 0/2 DOWN.
[WARNING]  (8) : Server node_text/node_text is DOWN. 0 active and 0 backup servers left. 0 sessions active, 0 requeued, 0 remaining in queue.
[ALERT]    (8) : backend 'node_text' has no server available!
[WARNING]  (8) : Health check for server node_page/node_page failed, reason: Layer4 connection problem, info: "Connection refused", check duration: 0ms, status: 0/2 DOWN.
[WARNING]  (8) : Server node_page/node_page is DOWN. 0 active and 0 backup servers left. 0 sessions active, 0 requeued, 0 remaining in queue.
[ALERT]    (8) : backend 'node_page' has no server available!
[WARNING]  (8) : Health check for server postgres/db_postgres succeeded, reason: Layer4 check passed, check duration: 1ms, status: 3/3 UP.
[WARNING]  (8) : Health check for server mongo/db_mongo succeeded, reason: Layer4 check passed, check duration: 0ms, status: 3/3 UP.
[WARNING]  (8) : Health check for server gunicorn/app_django failed, reason: Layer4 connection problem, info: "Connection refused", check duration: 1ms, status: 0/2 DOWN.
[WARNING]  (8) : Health check for server redis/db_redis succeeded, reason: Layer4 check passed, check duration: 1ms, status: 3/3 UP.
[WARNING]  (8) : Server gunicorn/app_django is DOWN. 0 active and 0 backup servers left. 0 sessions active, 0 requeued, 0 remaining in queue.
[ALERT]    (8) : backend 'gunicorn' has no server available!
[WARNING]  (8) : Health check for server redis/db_redis_pubsub succeeded, reason: Layer4 check passed, check duration: 1ms, status: 3/3 UP.
[WARNING]  (8) : Health check for server redis_story/db_redis_story succeeded, reason: Layer4 check passed, check duration: 0ms, status: 3/3 UP.
[WARNING]  (8) : Health check for server redis_sessions/db_redis_sessions succeeded, reason: Layer4 check passed, check duration: 0ms, status: 3/3 UP.
[WARNING]  (8) : Health check for server elasticsearch/db_elasticsearch failed, reason: Layer4 connection problem, info: "Connection refused", check duration: 0ms, status: 0/2 DOWN.
[WARNING]  (8) : Server elasticsearch/db_elasticsearch is DOWN. 0 active and 0 backup servers left. 0 sessions active, 0 requeued, 0 remaining in queue.
[ALERT]    (8) : backend 'elasticsearch' has no server available!
[WARNING]  (8) : Health check for server node_images/node_images succeeded, reason: Layer7 check passed, code: 200, check duration: 3318ms, status: 3/3 UP.
[WARNING]  (8) : Health check for server node_socket/node_socket succeeded, reason: Layer4 check passed, check duration: 0ms, status: 1/2 DOWN.
[WARNING]  (8) : Health check for server nginx/nginx succeeded, reason: Layer4 check passed, check duration: 1ms, status: 3/3 UP.
[WARNING]  (8) : Health check for server node_favicon/node_favicon succeeded, reason: Layer4 check passed, check duration: 0ms, status: 1/2 DOWN.
[WARNING]  (8) : Health check for server node_text/node_text succeeded, reason: Layer7 check passed, code: 200, check duration: 368ms, status: 1/2 DOWN.
[WARNING]  (8) : Health check for server node_page/node_page succeeded, reason: Layer7 check passed, code: 200, check duration: 163ms, status: 1/2 DOWN.
[WARNING]  (8) : Health check for server node_socket/node_socket succeeded, reason: Layer4 check passed, check duration: 0ms, status: 3/3 UP.
[WARNING]  (8) : Server node_socket/node_socket is UP. 1 active and 0 backup servers online. 0 sessions requeued, 0 total in queue.
[WARNING]  (8) : Health check for server node_favicon/node_favicon succeeded, reason: Layer4 check passed, check duration: 0ms, status: 3/3 UP.
[WARNING]  (8) : Server node_favicon/node_favicon is UP. 1 active and 0 backup servers online. 0 sessions requeued, 0 total in queue.
[WARNING]  (8) : Health check for server node_text/node_text succeeded, reason: Layer7 check passed, code: 200, check duration: 5ms, status: 3/3 UP.
[WARNING]  (8) : Server node_text/node_text is UP. 1 active and 0 backup servers online. 0 sessions requeued, 0 total in queue.
[WARNING]  (8) : Health check for server node_page/node_page succeeded, reason: Layer7 check passed, code: 200, check duration: 6ms, status: 3/3 UP.
[WARNING]  (8) : Server node_page/node_page is UP. 1 active and 0 backup servers online. 0 sessions requeued, 0 total in queue.
[WARNING]  (8) : Health check for server gunicorn/app_django succeeded, reason: Layer4 check passed, check duration: 0ms, status: 1/2 DOWN.
[WARNING]  (8) : Health check for server gunicorn/app_django succeeded, reason: Layer4 check passed, check duration: 1ms, status: 3/3 UP.
[WARNING]  (8) : Server gunicorn/app_django is UP. 1 active and 0 backup servers online. 0 sessions requeued, 0 total in queue.
[WARNING]  (8) : Health check for server elasticsearch/db_elasticsearch succeeded, reason: Layer4 check passed, check duration: 1ms, status: 1/2 DOWN.
[WARNING]  (8) : Health check for server elasticsearch/db_elasticsearch succeeded, reason: Layer4 check passed, check duration: 0ms, status: 3/3 UP.
[WARNING]  (8) : Server elasticsearch/db_elasticsearch is UP. 1 active and 0 backup servers online. 0 sessions requeued, 0 total in queue.
That first screenshot is showing a broken NewsBlur missing a CSS file. What do you see in the web inspector when you look for broken links or CSS. Is it a 404 to a CSS file? What is that URL? Do you have DEBUG_ASSETS turned on or off in docker_local_settings.py or your own local_settings?